
Prices
Dates
Mon, Mar 27, 2023 - Fri, Apr 21, 2023
Recent
- Wednesday, Apr 12, 2023, All day
- Thursday, Apr 13, 2023, All day
- Friday, Apr 14, 2023, All day
- Saturday, Apr 15, 2023, All day
- Sunday, Apr 16, 2023, All day
- Monday, Apr 17, 2023, All day
- Tuesday, Apr 18, 2023, All day
- Wednesday, Apr 19, 2023, All day
- Thursday, Apr 20, 2023, All day
- Friday, Apr 21, 2023, All day
Event Details
Science Gallery Atlanta at Emory University, in partnership with Georgia Tech Arts and Komansé Dance Theater, is excited to announce: Strive for Open Science – A Data Visualization Competition.
Georgia Tech students will have a month to take a given dataset and translate it into engaging, accessible, and legible data visualizations, with the winner getting the opportunity to present their work at a Science Gallery Atlanta public program (program details to be created in conjunction with the winner)!
No prior experience with data? No worries! This competition is suitable as an entry into data visualizations. Already a data expert? We encourage you to stretch your skillset and your understanding of what data can be. What can you create when you let your imagination lead?
Key Dates:
Competition Opens & Dataset Announced – Monday, March 27
Creating Accessible Data Visualizations Workshop – Wednesday, April 5, 11 a.m. - 1 p.m.
Competition Close – Monday, April 17
Winner Announced – Monday, April 24
View the Creating Accessible Data Visualizations workshop presentation (requires Adobe Reader)
The Dataset
Data conveys tremendous meaning. Hidden within the rows and rows of unintelligible statistics lay real people with real experiences. However, the monotony of spreadsheets can’t convey the emotional significance of what the data represents. Although traditional graphs do a more effective job at synthesizing the sea of information, they serve as a stoic outsider to the originating context and communities that the data represents. How can we pack more meaning into the ways in which we visualize data?
Georgia Tech students are tasked with taking a familiar public data set and creating accessible, creative, informative, and emotionally impactful data visualizations.
The dataset is COVID-19 Case Surveillance Data with Geography
This case surveillance public use dataset has 19 elements for all COVID-19 cases shared with CDC and includes demographics, geography (county and state of residence), any exposure history, disease severity indicators and outcomes, and presence of any underlying medical conditions and risk behaviors.
Requirements
Register for the Strive for Open Science Competition.
Use the provided dataset to create an original data visualization that emphasizes accessibility, creativity, emotional impact, and information content.
Submit your data visualization before the competition closes on Monday, April 17th.
Prizes
Chosen finalists, selected by an expert panel of judges, will present their visualizations as a part of the Tech Arts Festival set design. At the block party the community will vote on which submission takes first-place, with the winner getting the opportunity to present their work at a Science Gallery Atlanta public program (program details to be created in conjunction with the winner)!
Judging Criteria
Accessibility (Based on the W3C Standards). Legibility. Informative Content. Creativity. Emotional Impact.
Resources
Designing Charts - Principles Every Designer Should Know
Web Content Accessibility Checklist (TOOL)
Testing for Accessible Data Visualization (TOOL)
Accessible Data Visualization Resources
Resources to Learn More About Digital Accessibility
Web Content Accessibility Guideline (WCAG) Overview
W3C: Web Accessibility Initiative
Location
More on Science Gallery Atlanta
The Science Gallery Network is an international collaboration of leading universities dedicated to public engagement through interdisciplinary art-science initiatives. The Network seeks to change the world through youth-led perspectives, igniting conversations and collaborations to support young people to find connection, hope and agency through curiosity and creativity, …
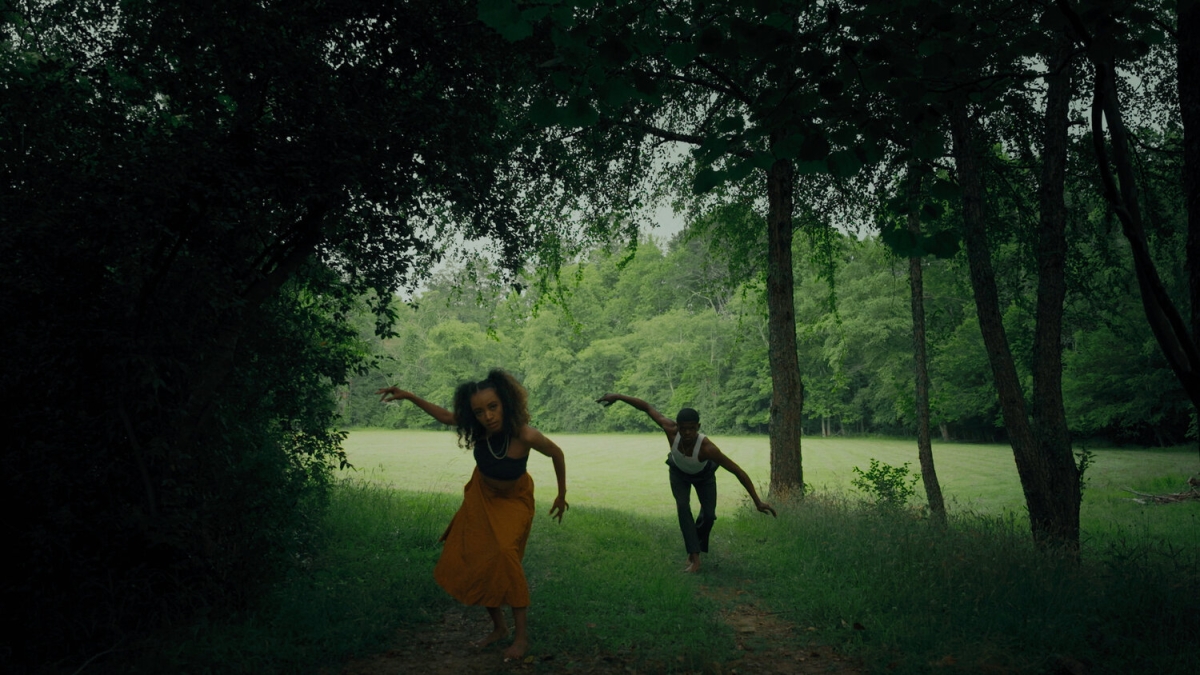
More on Komansé Dance Theater
Komansé Dance Theater’s mission is to use art to challenge, create, and cultivate, uncompromising storytelling for the culture. The company utilizes the medium of Black cultural expression to unpack current issues surrounding social activism.
Artistic Director, Raianna Brown, seeks to create work that speaks to people’s experiences and the…